Among the myriad of financial reporting issues associated with COVID-19, cautions Deloitte, is the need for robust and transparent disclosure and communication. Given the inherent volatility and fluidity of today’s markets, and overall economic impact of the pandemic, Robotic process automation (RPA) and data visualization are now requisites for corporate financial officers.
The application of RPA allows financial planning and analysis (FP&A) professionals, the people responsible for analyzing financial metrics like sales and expenses for forecasting and budget needs, to streamline and operationalize the gathering, processing, modeling, and reporting of data.
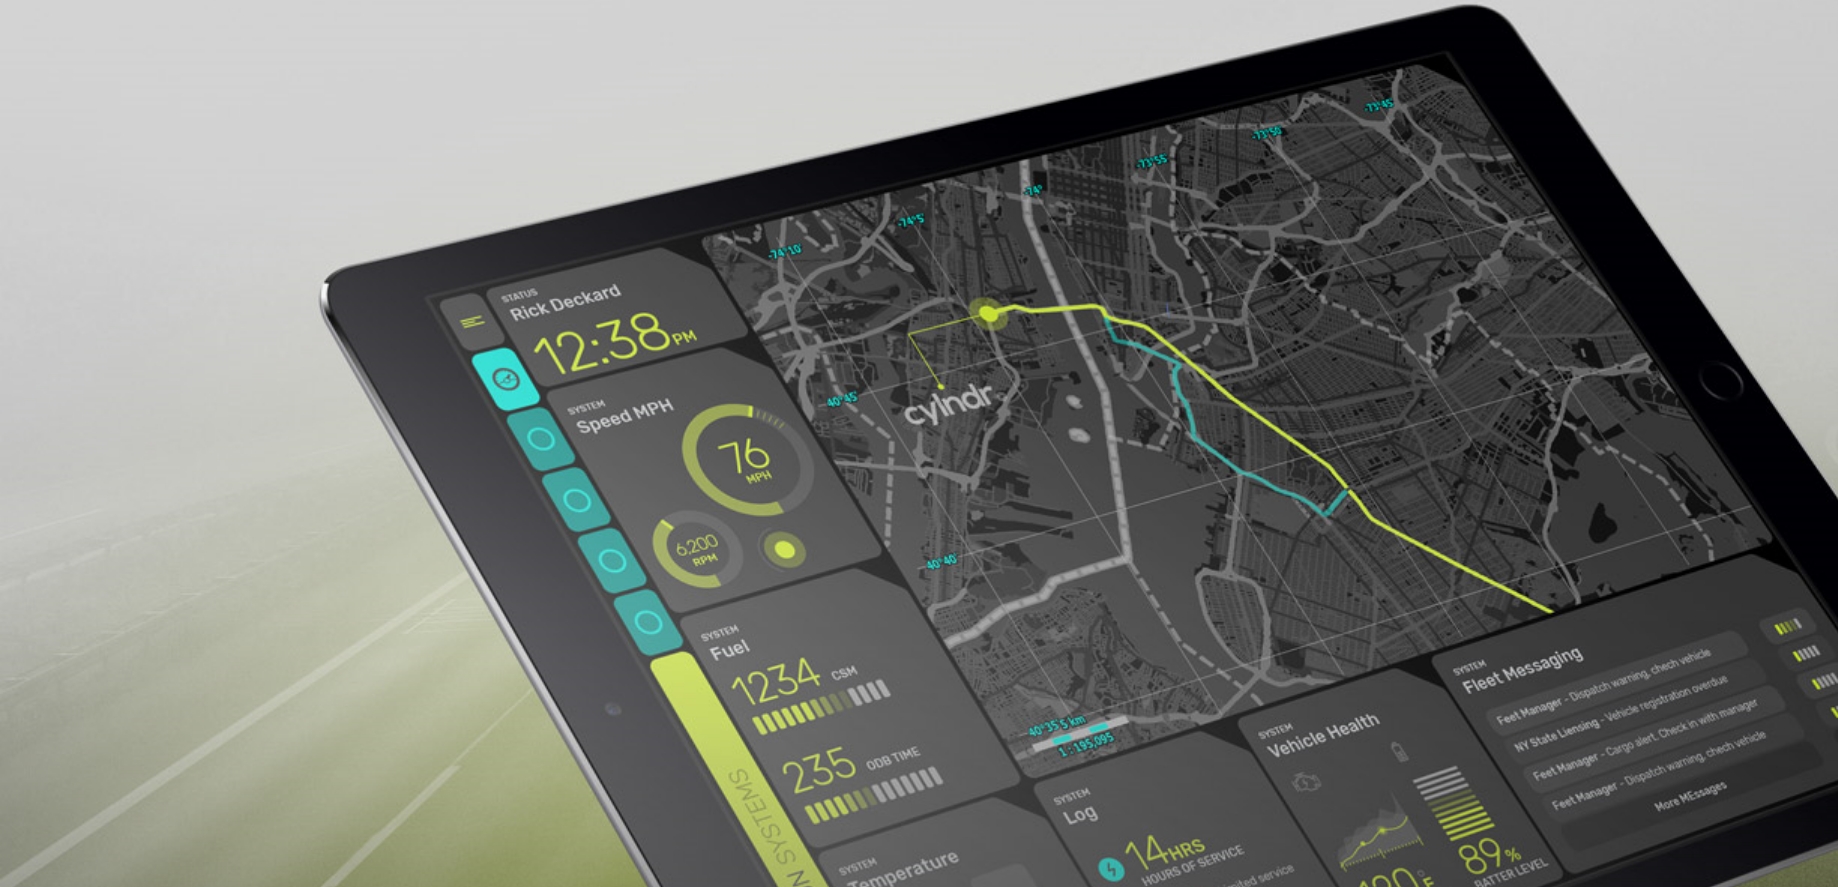
Today, firms are swimming in data. RPA is often coupled with business Intelligence (BI) platforms that use artificial intelligence to absorb and analyze petabytes of data, producing digestible and actionable intelligence in seconds. BI dashboards like DOMO and Tableau, available as-a-service, transform structured data into customized visualizations that provide access to insights on a single screen.
With RPA, FP&A professionals can process vast amounts of information in minutes instead of hours by automating the ingestion and analysis of internal data and public filings.
According to Forrester, RPA robots are capable of mimicking many–if not most–human user actions. They log into applications, move files and folders, copy and paste data, fill in forms, extract structured and semi-structured data from documents, scrape browsers, and more.
By automating repetitive, manual, processes, RPA platforms alleviate humans from mundane, error-inducing tasks, such as the gathering of accounting data from disparate, legacy systems, and the organization of that data into structured data sets.
When it comes to analytics, data democratization and organizational data literacy are paramount; tools that make data available to all stakeholders enable companies to make faster, better-informed decisions.
When integrated with RPA, data visualization extends the power of automation by instantly producing insightful analyses from structured data sets in the form of user-friendly graphical illustration. Of note is that the ability to communicate complex financial statistics as visualizations increases the population of end-users that can understand this data.
With user experience anchoring design, Proviniti designs, develops and deploys cloud-based, self-service analytics, leveraging AI to answer demand for data-driven solutions.


